
Fault tree analysis (FTA) in fleet maintenance
 Jade Zart 9 min read

A fault tree can support more complete analyses in fleet management, especially in vehicle maintenance. It organizes, visually, the possibilities that can lead to a failure and helps the team discuss the problem before choosing a correction.
The method is well known in industrial maintenance and in reliability analyses. In the fleet, it does not replace inspection, technical diagnosis or the manufacturer's recommendation; it serves to gather evidence, make hypotheses explicit and prevent the first explanation found from being treated as the definitive cause.
See what a fault tree is, its objectives, its elements and how to start using it in the operation:
- what a fault tree is;
- what its objective is;
- why it can be important for fleet maintenance;
- how it works;
- how to build a fault tree.
What is a fault tree?
A fault tree is an analysis method that starts from an undesired event — the failure you want to investigate — and breaks down the conditions and events that could lead to it. The analysis is usually called FTA, short for Fault Tree Analysis.
The result is a visualization of the cause-and-consequence relationships considered for that case. It can be used together with other maintenance resources, inspection records and diagnosis to prioritize checks and discuss preventive measures. The tree, by itself, does not prove the cause of a failure: the hypotheses need to be confirmed with evidence from the operation and technical assessment.
When investigating an occurrence, the method helps prevent the team from correcting only the symptom. This can help control maintenance costs, reduce unexpected events and document the reasoning adopted, without promising that a single analysis eliminates all risks.
What is the objective of fault tree analysis?
Generate information and knowledge for the fleet and/or maintenance manager
Supervisors and managers make decisions involving cost, safety, availability and planning. Analysis tools help organize what has already been observed and make clear which data is still missing before deciding.
The tree brings together information collected in the fleet's routine, but presents it through a different, visual logic. This can reveal relationships that are not evident in an isolated record and create a basis for discussion between maintenance, operations and management.
For this reason, one of its objectives is to turn occurrences and inspections into reusable knowledge. The learning does not come only from the diagram: it depends on recording what was confirmed, what was discarded and which service was carried out after the analysis.
Avoid “superficial” corrections of a problem
When a fault tree is applied to the transport operation, the problem should not simply be corrected and forgotten. The occurrence is recorded and assessed so that the variables that could lead to it are examined.
This helps investigate whether there is a deeper cause or a combination of conditions. Even so, it is not correct to assume that every relationship raised is the “true root”: components, conditions of use and the vehicle's history need to be inspected. The usefulness of the method lies in guiding the investigation and making the criteria visible.
Allow a failure to be fully understood
Visualizing the possible variables also broadens the understanding of how the vehicle works and of the routine in which it operates. Besides investigating that occurrence, the team can record questions and data that should be observed in similar failures.
With a structure updated after the services, the tree can become a basis for future analyses. It does not replace the diagnosis of each case, but it keeps the team from always starting from scratch and can make triage more organized.
Identify the most suitable solution that prevents the failure from happening again
After confirming a relevant cause or condition, the team can choose a correction that addresses the problem identified, and not only its apparent effect. The action may involve repair, process adjustment, a change in inspection or later follow-up, depending on the case.
A well-documented intervention can reduce the chance of recurrence for the same reason, but it does not guarantee that the failure will never happen again. The team needs to keep track of the result in the fleet and review it when new evidence emerges. Keeping track of results this way is one of the impacts of maintenance management that the tree can support.
Why is it important for fleet maintenance management?
It generates failure mapping
As a problem occurs, its possible reasons can be identified and studied. The tree organizes this map of hypotheses and can be supplemented after the service is carried out, with what was found in the vehicle and with the results of the correction.
This makes it possible to compare the initial hypothesis with the outcome of the maintenance. Over time, the history helps identify patterns, but it should not be used to ignore the particularities of a vehicle or a new occurrence.
It reduces unscheduled maintenance and fleet costs
Failures and unexpected events on the road can generate unscheduled maintenance. When the causes and conditions are investigated, the operation gains information to adjust preventive routines and watch for similar signs before they become a new occurrence.
The effect on costs depends on the quality of the diagnosis, the repair and the checks that follow. Instead of promising that the problem will be resolved for good, use the analysis to decide what to check, which measures to test and which results to keep track of.
It increases fleet safety
Fewer operating failures tend to contribute to a more predictable operation, but safety depends on several factors beyond maintenance. Inspections, vehicle condition, conduct, route, load and work procedures need to be considered together.
By recording a failure and its conditions, the team can decide whether it requires priority, taking the vehicle out of service, immediate maintenance or monitoring. This process improves communication about risks without replacing the applicable safety rules.
How does a fault tree work?
To build and use the tree correctly, learn three fundamentals: the construction stages, the types of event and the logic gates that represent the relationships between them.
1 – Fault tree stages
- Define the event to be analyzed: which failure will be investigated? The event should be specific enough for everyone to understand what is being analyzed.
- Identify possibilities that can lead to the event: which components, conditions of use, procedures or occurrences need to be checked?
- Structure the cause-and-consequence relationships: how do the possibilities connect? Can they happen together, separately or in sequence?
- Build the version of the tree for the problem: with the information available, put together the diagram and make the hypotheses, evidence and gaps explicit.
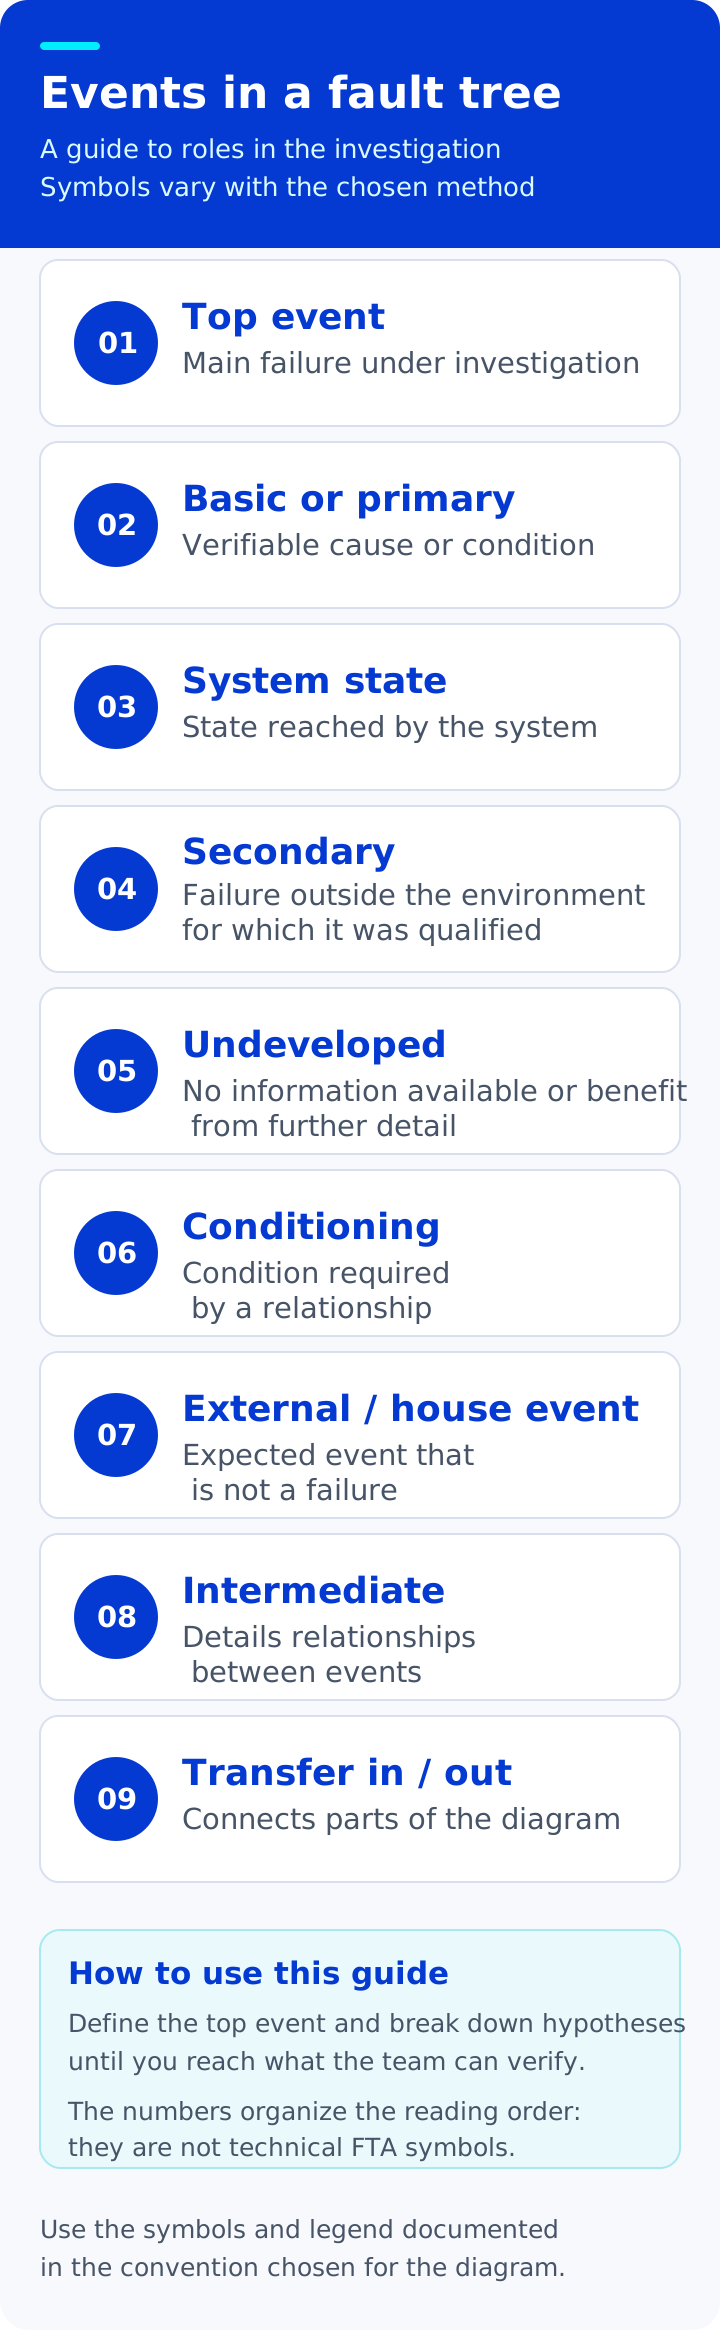
2 – Fault tree events
- Top event: the main failure investigated by the tree.
- Basic or primary event: a component failure or condition that can contribute to the event analyzed.
- System or subsystem state: a condition that the vehicle or a part of it reaches during the process.
- Secondary event: failure of a component in an environment for which it was not qualified. Undeveloped event: an event not explored further because it has insufficient consequence or because of a lack of pertinent information, according to the NASA handbook.
- Conditioning event: a factor that establishes a condition for a given relationship to happen.
- External event: to represent the idea originally described by this name, check the convention adopted. The NASA handbook uses house event for a normally expected event that, by itself, is not a failure.
- Intermediate event: an event used to detail the relationship between causes and the top event.
- “In” transfer and “out” transfer: connectors that relate parts of the diagram or different trees.
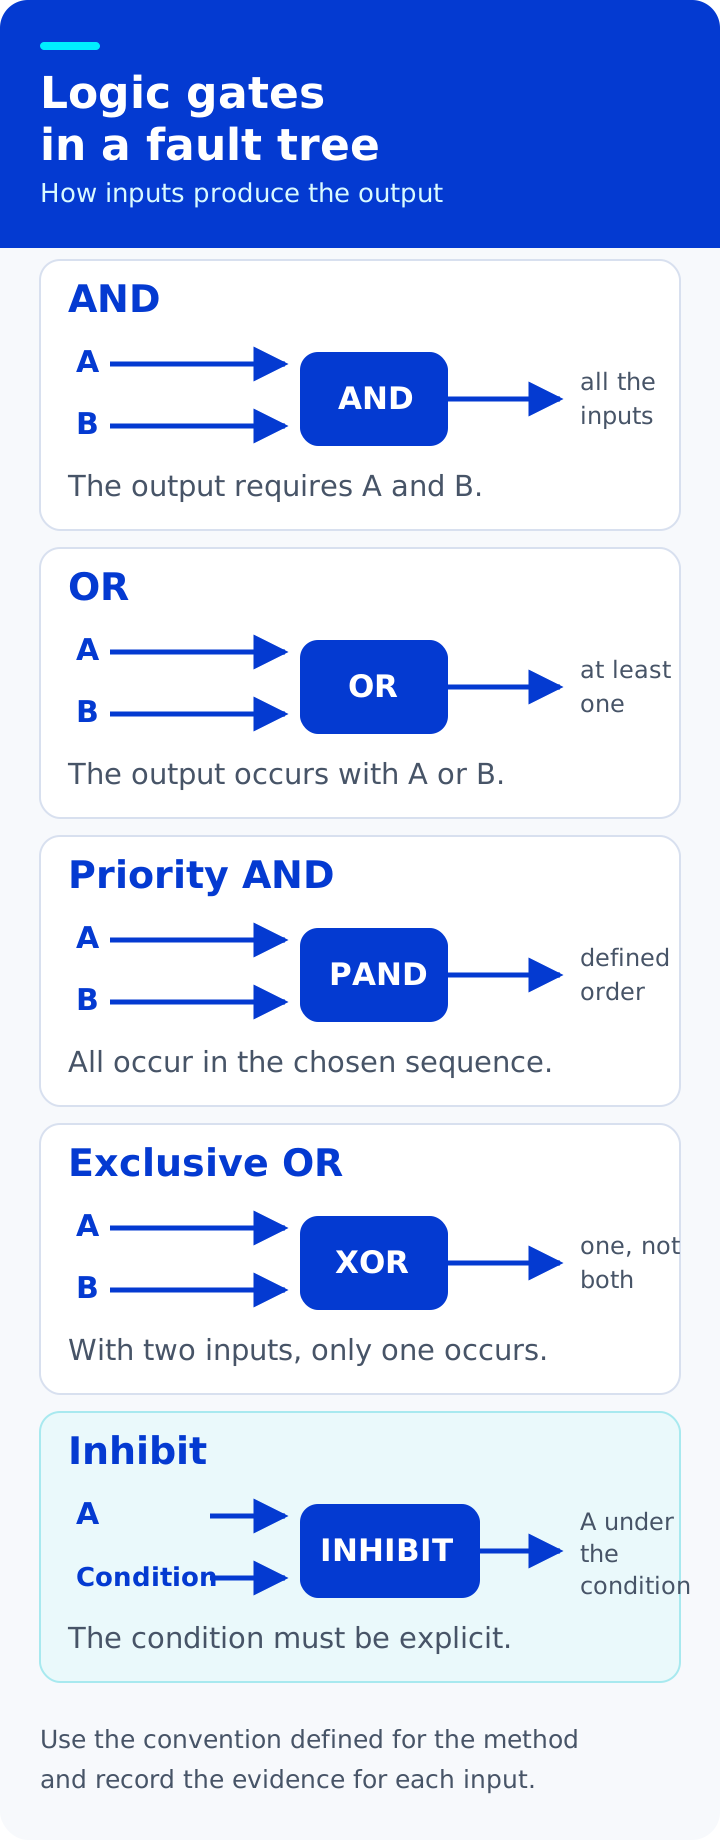
3 – Fault tree gates
- “AND” gate: the output event occurs when all the necessary inputs occur.
- “OR” gate: the output event occurs when at least one of the inputs occurs.
- Priority “AND” gate: represents a relationship in which the sequence of the inputs matters, according to the model adopted.
- Exclusive “OR” gate: in the usual case of two inputs, the output event occurs when one of them happens, but not when both happen, according to the NASA handbook.
- Inhibit gate: represents an input that produces the output only under a specified condition.
How do you build a fault tree?
Before drawing the tree, select the event to be analyzed and gather the available records: symptoms, inspections, maintenance history, conditions of use and services already carried out. List the possible factors without turning assumptions into facts.
Next, organize the relationships between events and apply the corresponding symbols and gates. Review the diagram with those who know the vehicle and the occurrence, indicating what was confirmed, what still needs testing and what does not apply. The tree can be changed when maintenance brings new evidence.
Fault tree example:
Consider an engine that will not start. Among the possibilities to check are fuel supply, ignition system, battery, electrical connections, fuses and other components defined for that vehicle. These can be intermediate events in the tree, but the list does not replace the technical procedure recommended by the manufacturer.
If the investigation points to a lack of fuel in the engine, for example, it will still be necessary to check which conditions can explain this, such as a blockage, a supply problem or another cause confirmed in the inspection. Each factor can be broken down to the basic events that the team is able to check.
The gates represent how these events relate to each other: they can be dependent, alternative or conditional. To avoid errors and rework, gather the available information before completing the diagram and record the evidence that supports each relationship.
Beyond the fault tree
Building the tree should be combined with maintenance controls, because it deals with one event and its hypotheses. A predictive maintenance routine, when applicable, can provide data to investigate conditions and keep track of the analysis's conclusions.
Other practices can start with simple tools, such as maintenance control spreadsheets. See how to put together a template to use in the fleet.
Sources consulted
- NASA — Fault Tree Handbook with Aerospace Applications: reference for the definition of FTA, its analysis logic and the elements of a fault tree.
- NASA — Appendix I-3.5, Fault Tree Analysis: reference for the approach of starting from an undesired event and examining contributing events.
Frequently asked questions
What is a fault tree?
What is a fault tree for in fleet maintenance?
What are the events in a fault tree?
What are the logic gates of a fault tree?
How do you build a fault tree?
// newsletter
Fleet management content, straight to your inbox
Articles on tires, maintenance and fleet operations. No spam.


