
Maintenance indicators: MTBF, MTTR and reliability
 Luiz Felipe 8 min read

Maintenance indicators help keep track of how the department is working and provide a basis for decisions at the carrier. To be useful, they need a stable definition, a known data source and people responsible for reading them.
Keeping track of them makes it possible to set goals and check trends, but it does not guarantee results on its own. Goals need to take into account the vehicle type, the operation, the workshop's capacity and the history available.
With records of vehicles sent to the shop and of maintenance jobs, the manager can calculate times, costs and recurrences. These numbers support the review of processes and the choice of tools, without replacing the investigation of the causes of each failure.
To analyze fleet maintenance, it is important to know the purpose and the limits of the most widely used indicators. Below, we present:
- The main fleet maintenance indicators;
- The difference between strategic, tactical and operational indicators;
- How to collect data to analyze these maintenance indicators;
- How to analyze the indicators.
Main fleet maintenance indicators
Mean Time Between Failures (MTBF)
MTBF is the acronym for Mean Time Between Failures. It relates operating time to the number of failures recorded and helps observe the recurrence of issues in repairable vehicles or components.
The calculation gives an average time between failures in the period analyzed, according to the formula:
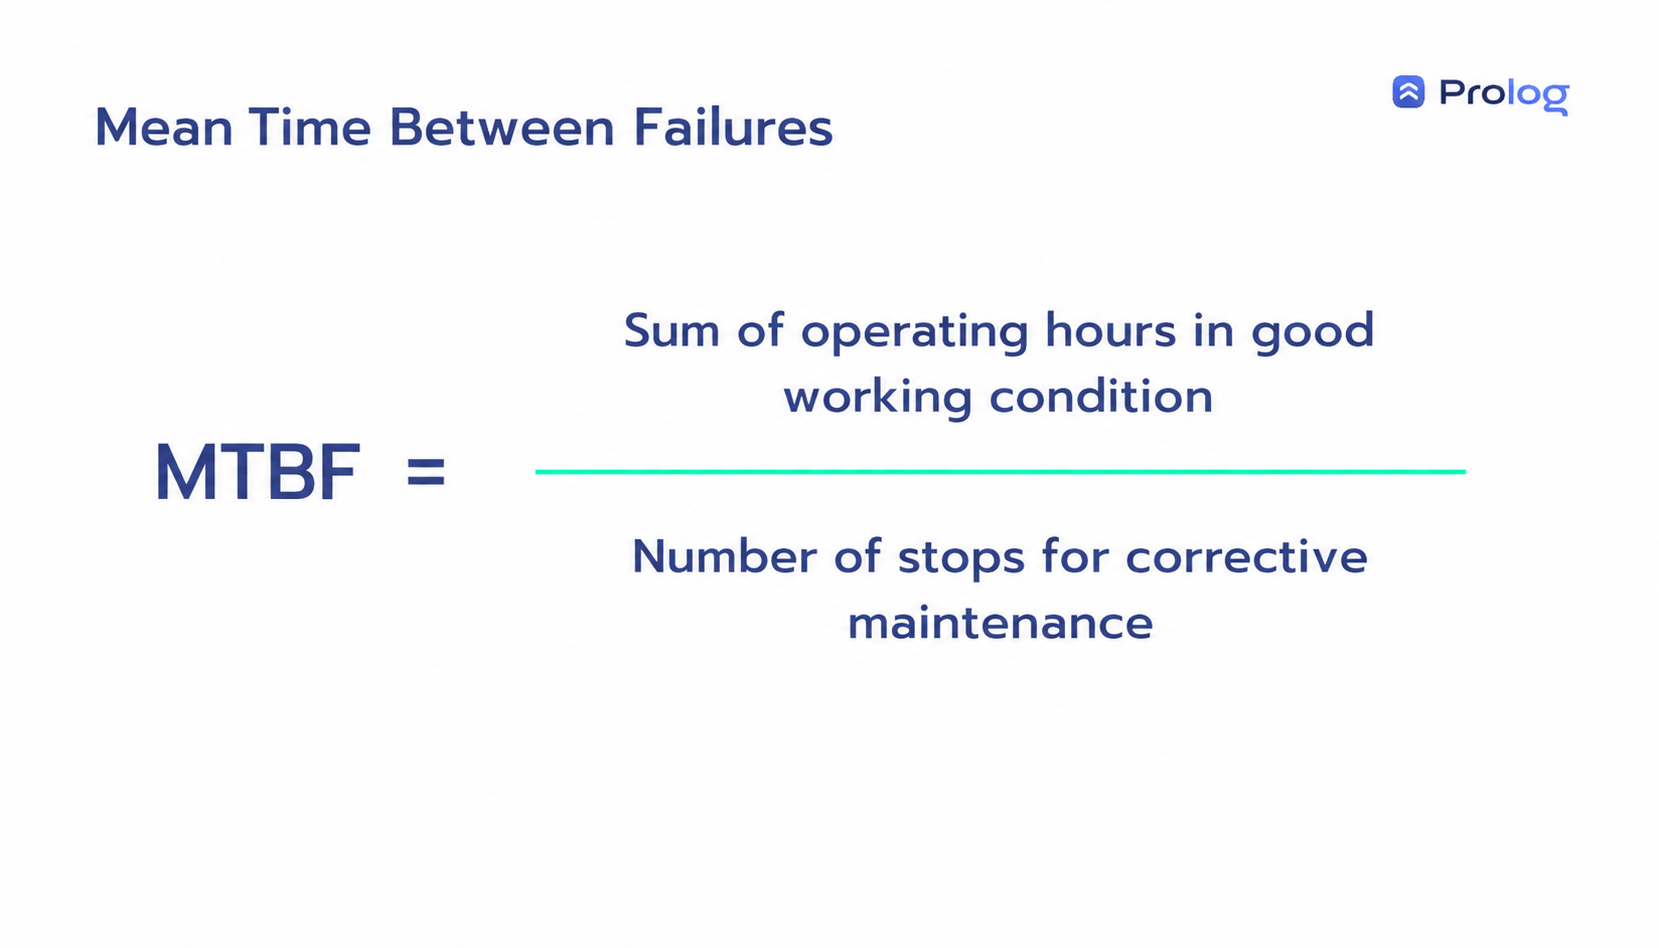
Mean time between failures formula.
For example, in a given period, the truck recorded:
- Trip 1: 140 hours;
- Trip 2: 120 hours;
- Trip 3: 200 hours.
Considering two stops for corrective maintenance in the period, the MTBF calculation is:
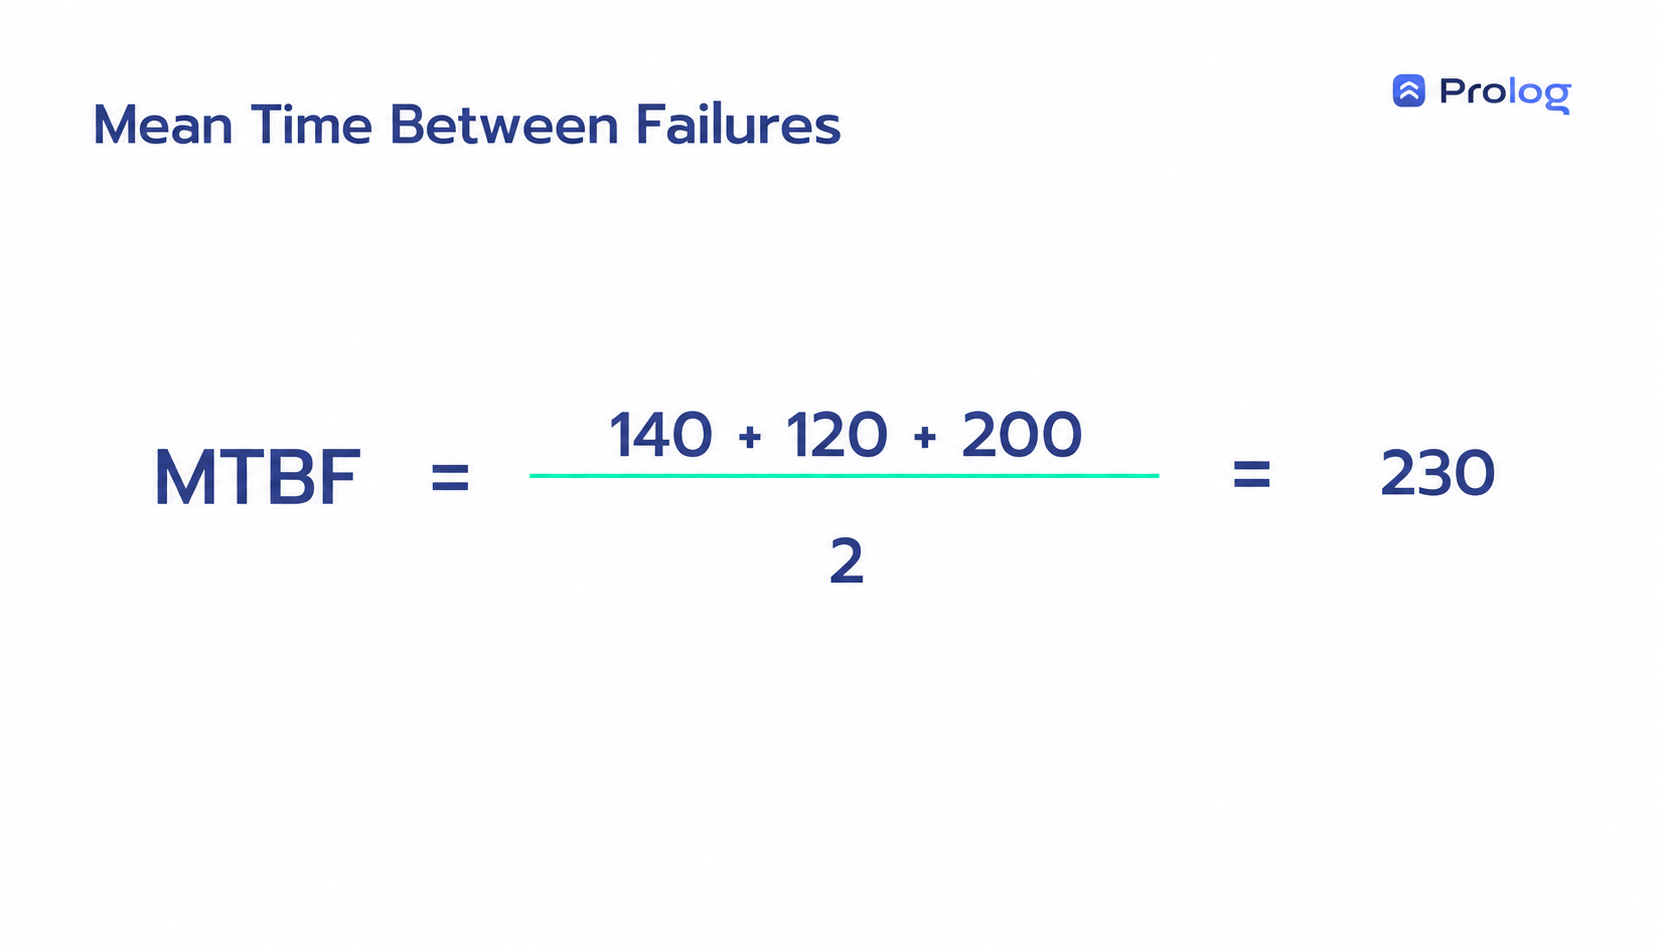
Example of an MTBF calculation.
By calculating the indicator per vehicle or component, the team can identify items that call for investigation or a review of the inspection frequency.
There is no single fraction of MTBF that determines the inspection of the whole fleet. The frequency should take into account technical recommendations, criticality, failure history, type of use and the capacity to carry out the inspection.
Use the result as a reference for analysis, not as an automatic work order. A preventive maintenance routine should be defined with technical criteria and reviewed when the history reveals a change in behavior.
MTBF can be part of the vehicles' reliability reading, which depends on the definition of the function observed and the interval analyzed.
Mean Time to Repair (MTTR)
MTTR is used for repairable equipment and vehicles. It shows the average time spent restoring a component or vehicle after a failure, within the start and end criteria defined by the operation.
A lower MTTR can indicate agility, but it should not encourage rushed or incomplete repairs. The target needs to balance time, quality, safety, parts availability and the check that the service was completed correctly.
The formula is:
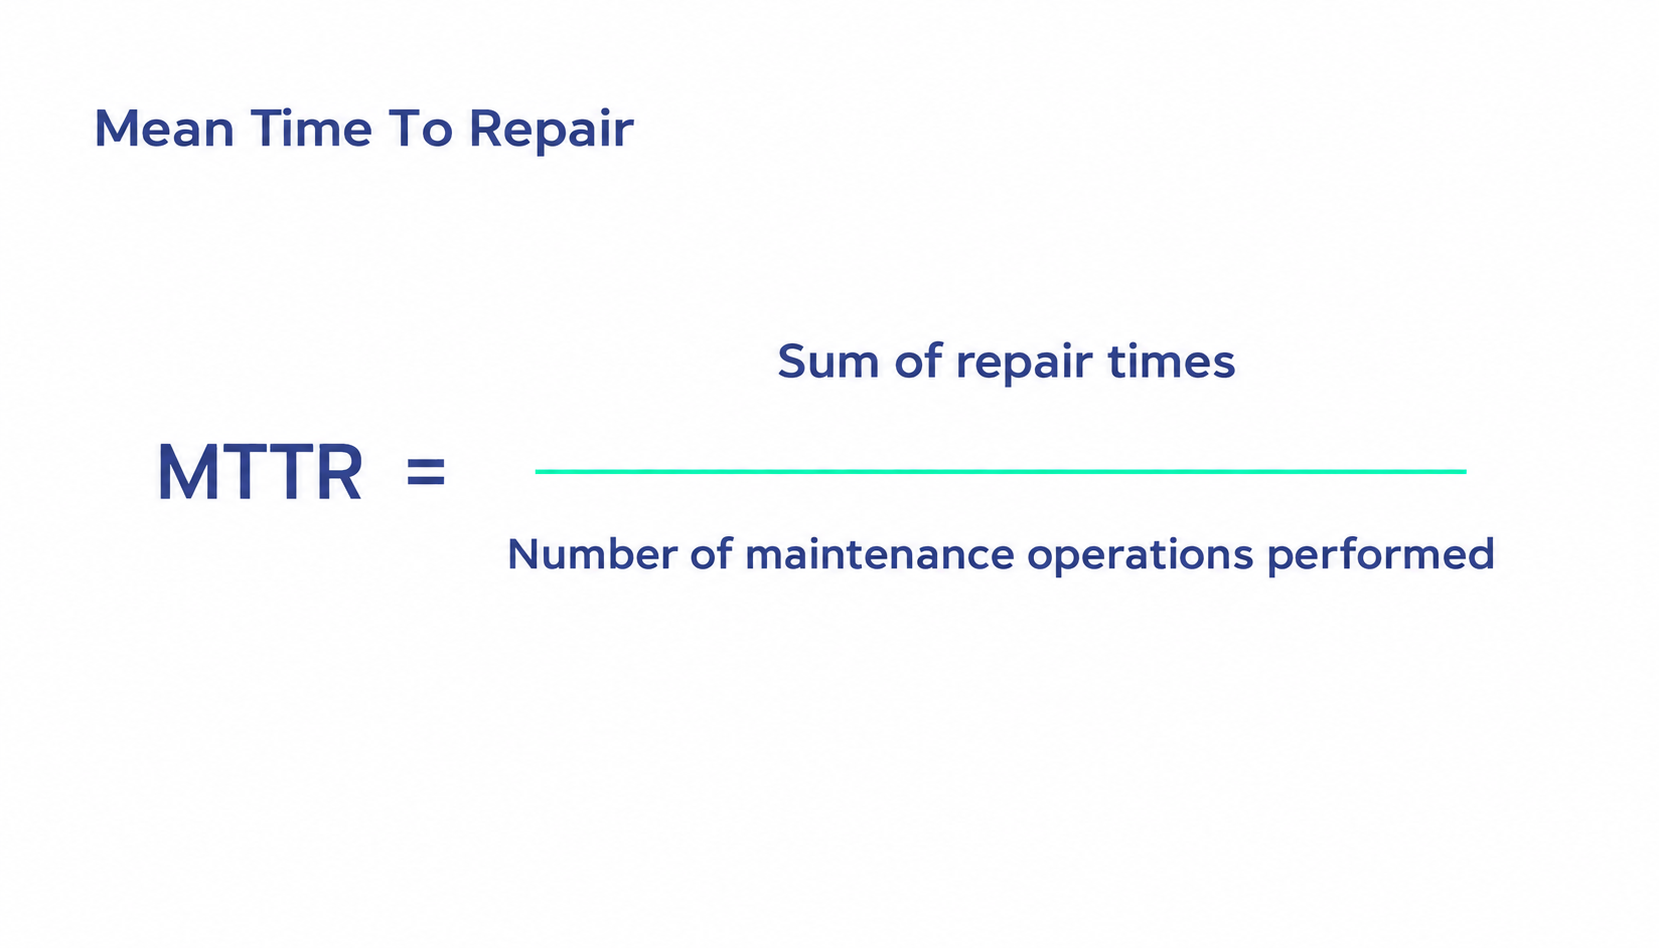
Formula for the fleet's vehicle MTTR.
Distribution of activity by type of maintenance
This indicator shows, through charts or reports, the proportion of activities by type of maintenance in the period.
There is no ideal percentage that works for every fleet. The distribution between corrective, preventive and predictive should be compared with the operation's own history, the criticality of the assets and changes in context; a variation deserves analysis, not an automatic conclusion.
Asset availability
The availability calculation shows how much time the asset was fit for use within the period. It helps prioritize components or vehicles that affect the operation when they fail.
To interpret this result, it is important that the criteria for failure, repair time and available time are applied consistently across periods.
The formula for it is:
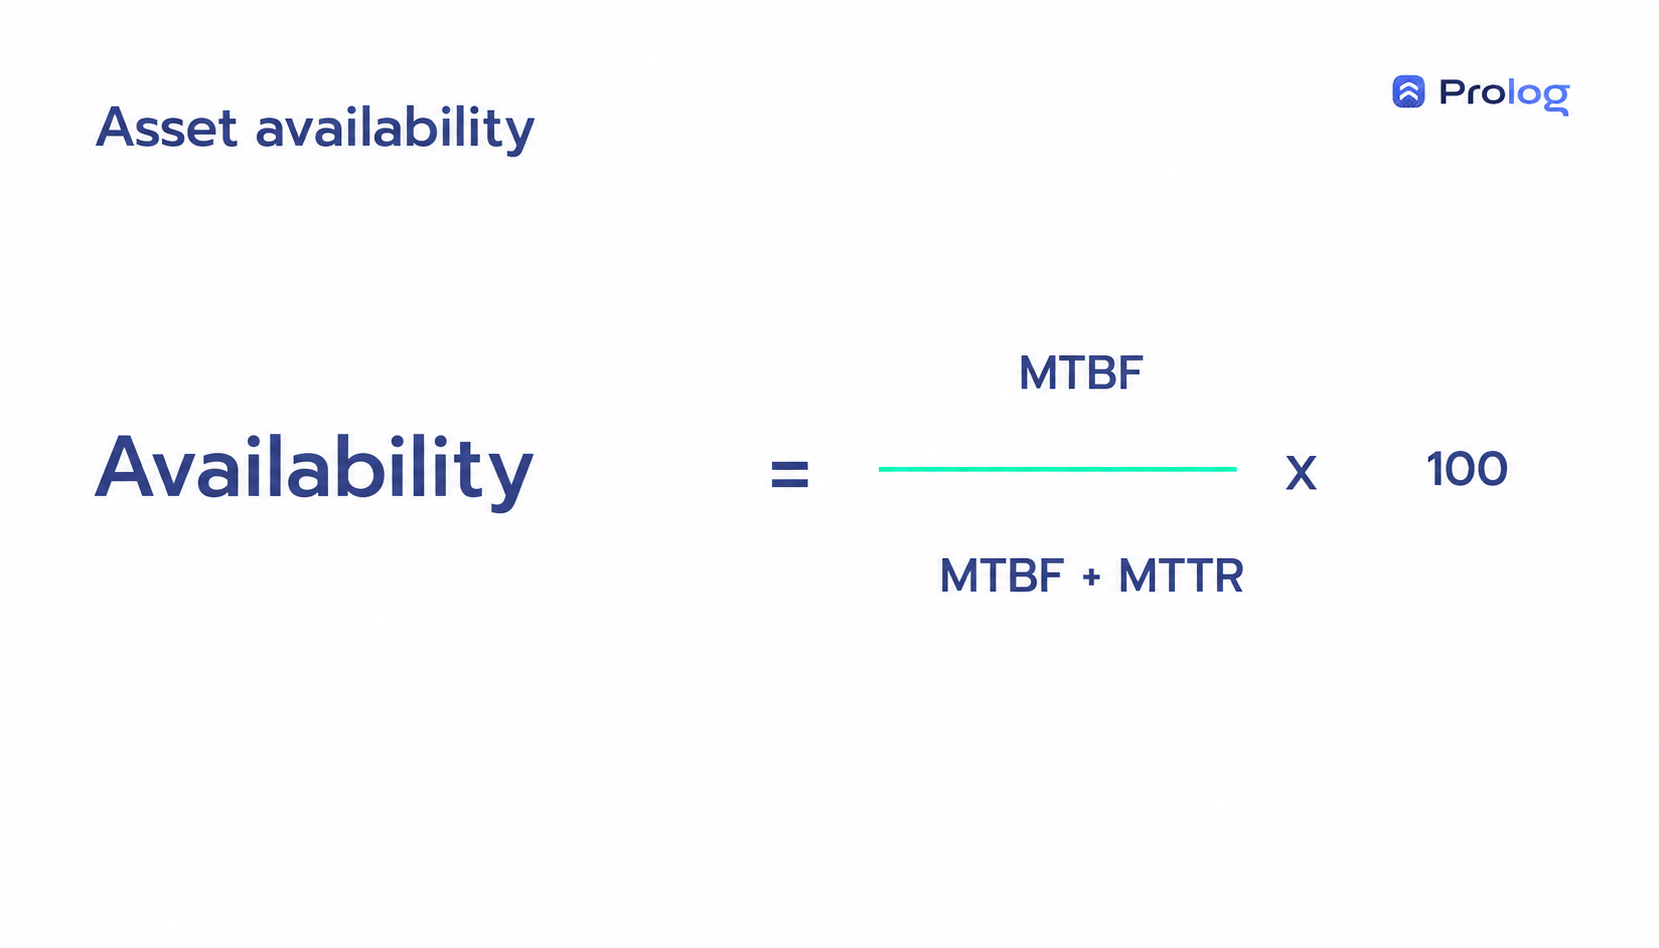
Formula to calculate the availability of the fleet's assets.
Asset reliability
The reliability indicator estimates the probability that a vehicle, component, piece of equipment or system will perform a defined function during an interval. For a useful reliability calculation, the function, the period and what counts as a failure need to be clear.
The result is a probability, not a guarantee that the asset will work or fail in an individual case.
The reliability calculation presented follows three steps:

Steps of the reliability calculation for the fleet's vehicles.
Maintenance cost and revenue (CMF)
CMF, the Brazilian acronym for maintenance cost over revenue, relates the total spent on maintenance to the carrier's gross revenue. It helps observe the financial weight of maintenance, as long as the period and the items included in the cost are consistent.
Do not use a generic average as the fleet's target. The result needs to be read as a historical series and together with factors such as vehicle age, type of operation, renewal policy and the accounting criteria adopted.
To calculate it:
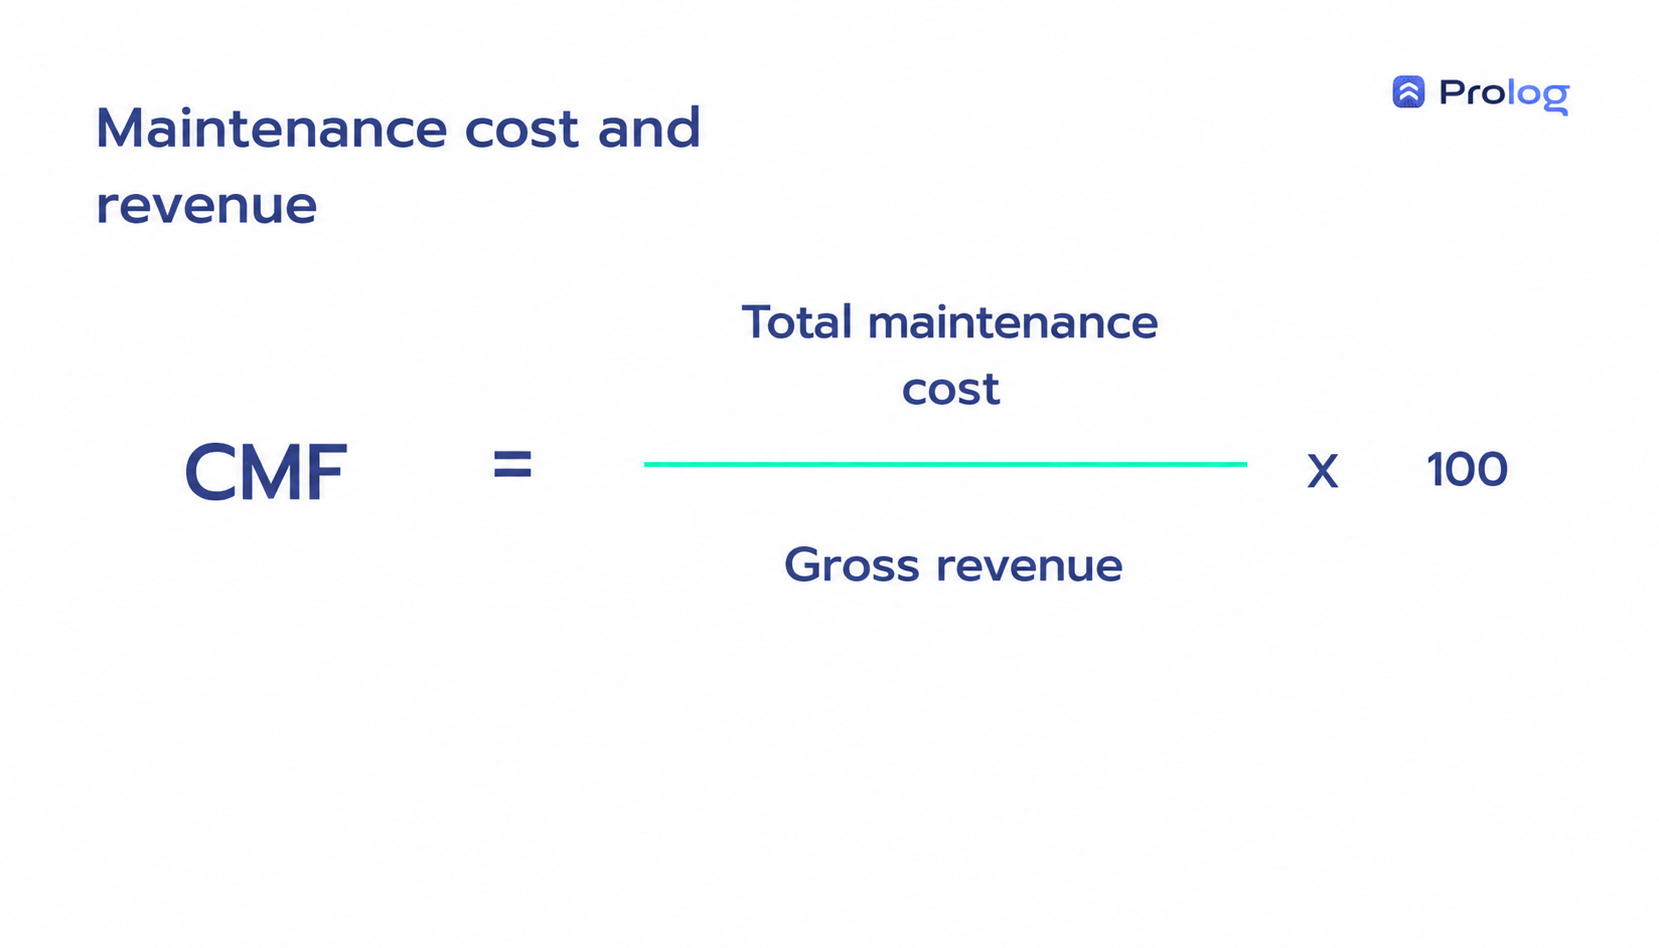
Calculation of maintenance cost over revenue.
Maintenance cost over replacement value (ERV or CPMV)
ERV, or Estimated Replace Value (CPMV is the Brazilian acronym), relates the maintenance cost to the replacement value. The comparison helps put a high-cost maintenance job into perspective against replacing the vehicle.
This calculation supports discussions about repair, renewal and budget, but it should not decide on its own. Availability, safety, how well the vehicle suits the service and the lead time for replacement also need to be part of the analysis.
The formula is simple:
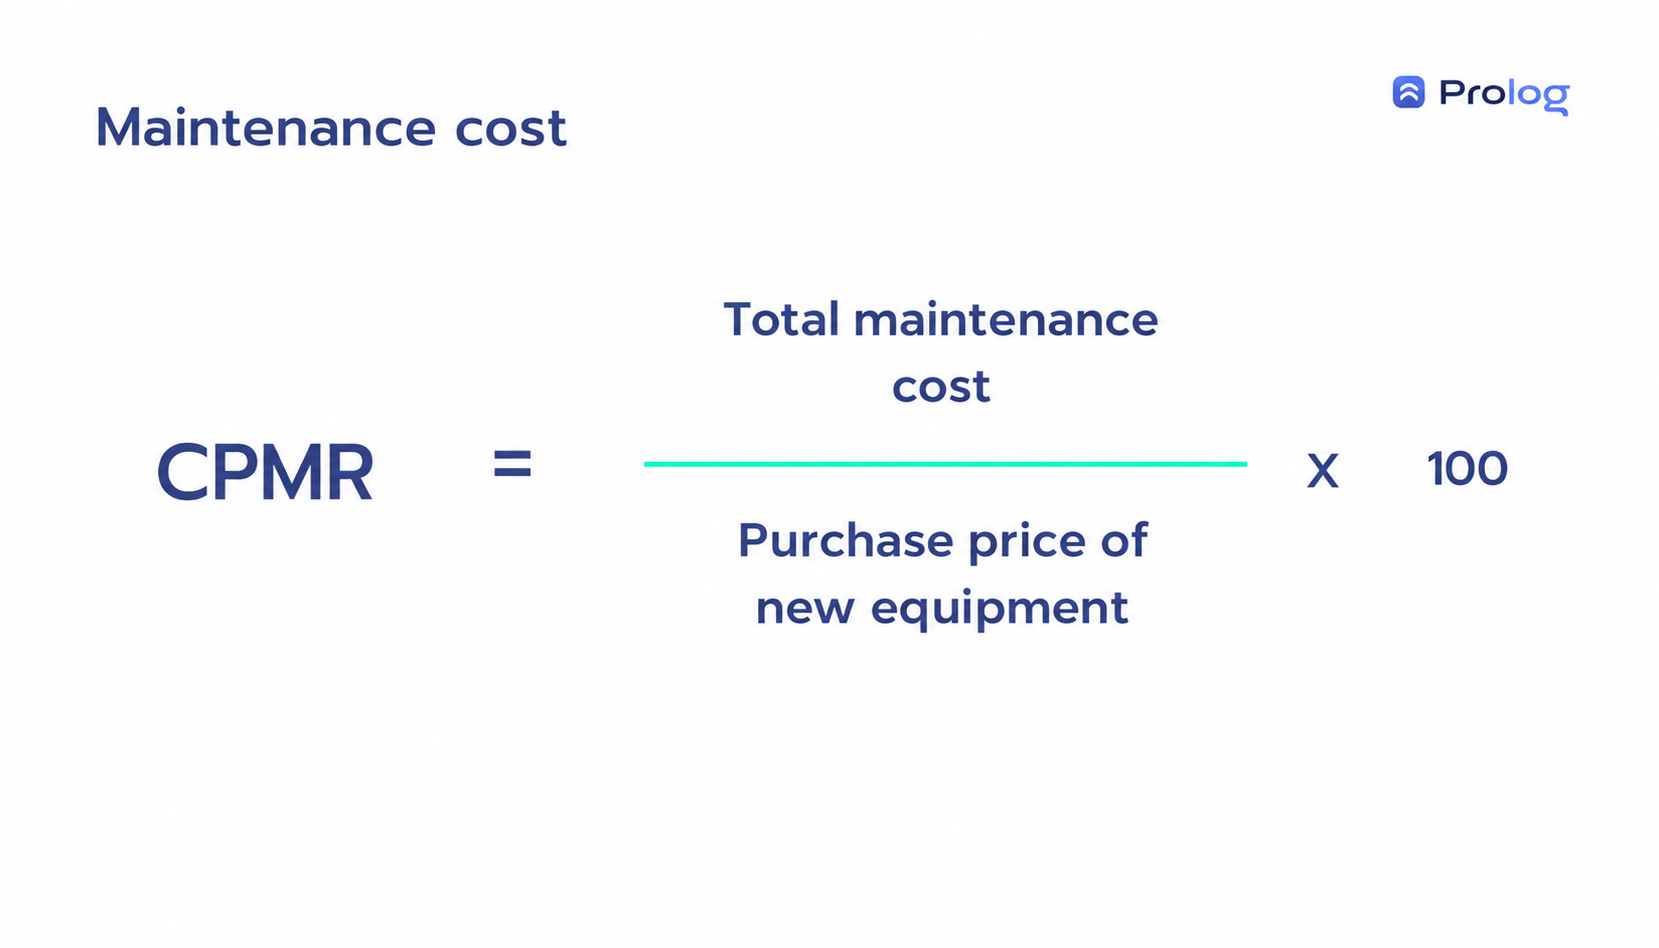
Formula to calculate the fleet's CPMR (maintenance cost over replacement value).
There is no universal percentage that determines when to replace a vehicle. Set your own limits and criteria, document the assumptions and reassess the decision when costs, reliability or availability change.
Difference between strategic, tactical and operational indicators
The three types of maintenance indicators have different functions and complement one another in reading the business and in the carrier's growth:
Strategic indicators
Strategic indicators connect to the company's vision and priorities. Tools such as SWOT analysis — internal strengths and weaknesses, external opportunities and threats — can support this definition.
That is why they look at the company beyond the workshop and may consider:
- Customer complaints;
- Customer compliments;
- Competitor analysis;
- Analysis of the overall political and economic landscape;
- Internal and external surveys in general.
Tactical indicators
Tactical indicators can be tracked by the coordinator or the fleet manager, because they translate priorities into the services of the work routine.
At this level, the analysis focuses on day-to-day operations and internal improvements. It can guide adjustments to routes, processes, purchasing and training, always comparing cost, expected effect and observed result.
Among the data to be collected and analyzed, we can mention:
- Punctuality and attendance;
- Percentage of work orders handled;
- Average handling time;
- Standardized completion of checklists and work orders;
- Among others.
Operational indicators
Operational indicators bring together records generated during execution, such as the vehicles' inspection history.
Examples are data on parts replaced, replacement frequency, observed durability and the occurrence of anomalies in each vehicle.
These records provide a basis for standardizing procedures and seeking savings without losing sight of safety and service quality.
How to collect data to analyze these performance indicators
Paper lists can record information, but they require consolidation discipline and make later lookups harder. A management system can provide faster and more organized access to fleet data, as long as the records are complete and reviewed.
With this kind of technology, the operation can:
- Carry out customized electronic checklists sent directly to the fleet control center;
- Have Work Orders opened automatically;
- Use technology in an intuitive and agile way, even without internet;
- Assess the items with the highest number of occurrences;
- View the average resolution time of Work Orders;
- Analyze the mechanics' average productivity;
- Speed up service and the completion of reports;
- Record the vehicle's occurrences and pending issues during the operation;
- And much more.
Tools such as the maintenance management system and the Electronic Checklist organize records for lookup and support the assessment of fleet data.
This data helps with planning when the team knows which decisions each indicator should support.
How to analyze maintenance indicators
With the numerical records, create reports and charts to compare equivalent weeks, months and years. It is also possible to compare makes and models, as long as usage and operating conditions are taken into account.
Some systems automate these comparisons, but the manager still needs to check filters, periods and criteria before using the result.
After mapping recurring issues, observe what is within the historical range and what requires investigation of performance, process or data entry.
When a number is far outside the norm, also review the data collection method. A seemingly negative result may reflect a recording failure, a change in criteria or incomplete collection coverage.
At this point, the whole team needs to understand what the indicators exist for and what action is expected from them.
In short, indicators need to be functional and understandable for those who use them.
Define an end goal, such as reducing waste, increasing availability or strengthening safety in the fleet. That way, each indicator becomes an instrument for finding and keeping track of solutions, and not just a number in a report.
Want to make it easier to keep track of the fleet's maintenance indicators? Book a demo of the solution and see the data and reports available for analysis.
Check out the video content:
(video in Portuguese)
Frequently asked questions
How do you calculate the reliability of a fleet vehicle?
What is MTBF and how is it calculated?
What is the difference between MTBF and MTTR?
What are the main fleet maintenance indicators?
What is the difference between strategic, tactical and operational indicators?
How do you analyze maintenance indicators?
// newsletter
Fleet management content, straight to your inbox
Articles on tires, maintenance and fleet operations. No spam.


