
ABC curve in fleets: how to classify inventory as A, B or C
 Jade Zart 6 min read

Fleet inventory control is essential for maintenance to happen in an organized and efficient way, ensuring the operation's performance and preventing vehicles from having a high incidence of idle time.
That is why using management techniques and methodologies at this stage contributes to companies' logistics optimization. One of these tactics is the ABC curve, which helps compare the relative value of the items in inventory and set priorities for keeping track of them.
- What is the ABC curve;
- Why use the ABC curve in fleets;
- How the ABC curve works;
- How to build the ABC curve in your fleet.
What is the ABC curve?
The ABC curve is a methodology for carrying out inventory management in many types of companies. For fleets and transport operations, it helps organize the vehicles' tires, parts and components, as well as the other items and resources for fleet maintenance.
It is called the “ABC curve” precisely because it is visualized as a chart with curves.
This technique is divided into three curves, where:
- Curve A: includes the items of high value and/or importance.
- Curve B: covers the items of intermediate value.
- Curve C: contains the items of lower value and lower importance.
It is generally a tactic used to analyze the items in your inventory, understand which ones carry the most weight in the total value and organize this area to gain more control and efficiency in operations.
Why use the ABC curve in fleets?
First, because the ABC curve creates a strategic and efficient organization of your inventory. Second, it also contributes to cost reduction, purchase planning and decision-making.
This happens because of the functions it makes possible, such as: prioritizing keeping track of the highest-value items, preventing the purchase of excess items, keeping important resources from running out in your inventory and supporting a more accurate demand forecast.
How does the ABC curve work in fleet inventory management?
The ABC curve starts with an inventory count of all the items in your fleet, which requires separating them into categories and determining their order of importance.
In addition, there are three categories for creating your curve: type of item, importance of the item to the operation and purchase value of the item. The logic is simple: A items sit above B items in management priority, and so on. Learn about each curve:
Curve A
This curve represents the items of greatest importance for the company's results. In a transport operation, it can represent the vehicles' tire inventory, since tires are fundamental for good performance and fuel economy on routes.
In this curve, it is important that the items are managed closely, always ensuring they are in proper condition and avoiding problems in the inventory or with asset availability.
Examples of items in category A:
- Critical engine replacement parts;
- Safety items;
- Air and oil filters for engine maintenance.
Curve B
This curve represents items of intermediate value, which means they are not as impactful as those in curve A, but they are more important than those included in curve C.
In the organization and inventory control of the fleet, they can be considered items that are used frequently and are relevant to the operation, but that do not require as much management attention as the items categorized in the previous curve.
The purpose of curve B is to keep these items from running out in the fleet and to ensure that vehicle maintenance takes place without failures or idle time.
Examples of items in category B:
- Batteries and electrical cables;
- Lubricants and various fluids;
- Suspension components.
Curve C
This last curve includes the items of lowest value and importance for the fleet. Generally, they do not directly impact the fleet's results and/or the vehicles' operation, but they still require management.
The general idea is that the items in curve A will always be a higher priority and those in curve C the lowest priority.
Example of items in category C:
- Cosmetic parts and accessories.
How do you build the ABC curve in your fleet management?
1 – List and take inventory of your items
To build the ABC curve, you first need to gather all the necessary information. In other words, start by listing and taking inventory of all the items you keep in inventory, including details such as their purchase value, the quantity used within a given period and their description.
A tire model, for example, needs to be identified by its make, model, size, function, quantity of units purchased and a comparison with the quantity used in the period.
2 – Do the calculation to classify the items into A, B and C
To separate more accurately which curve each item in your inventory is classified in, you can use a proportion calculation relative to financial value.
Generally speaking, the curves are divided as follows:
- Curve A: represents about 80% of the total value of the inventory.
- Curve B: represents around 10% to 15% of the total value of the inventory.
- Curve C: represents 5% to 10% of the total value of the inventory.
That is why the calculation should show how much each item represents in the total value of your inventory. Check out the formula:
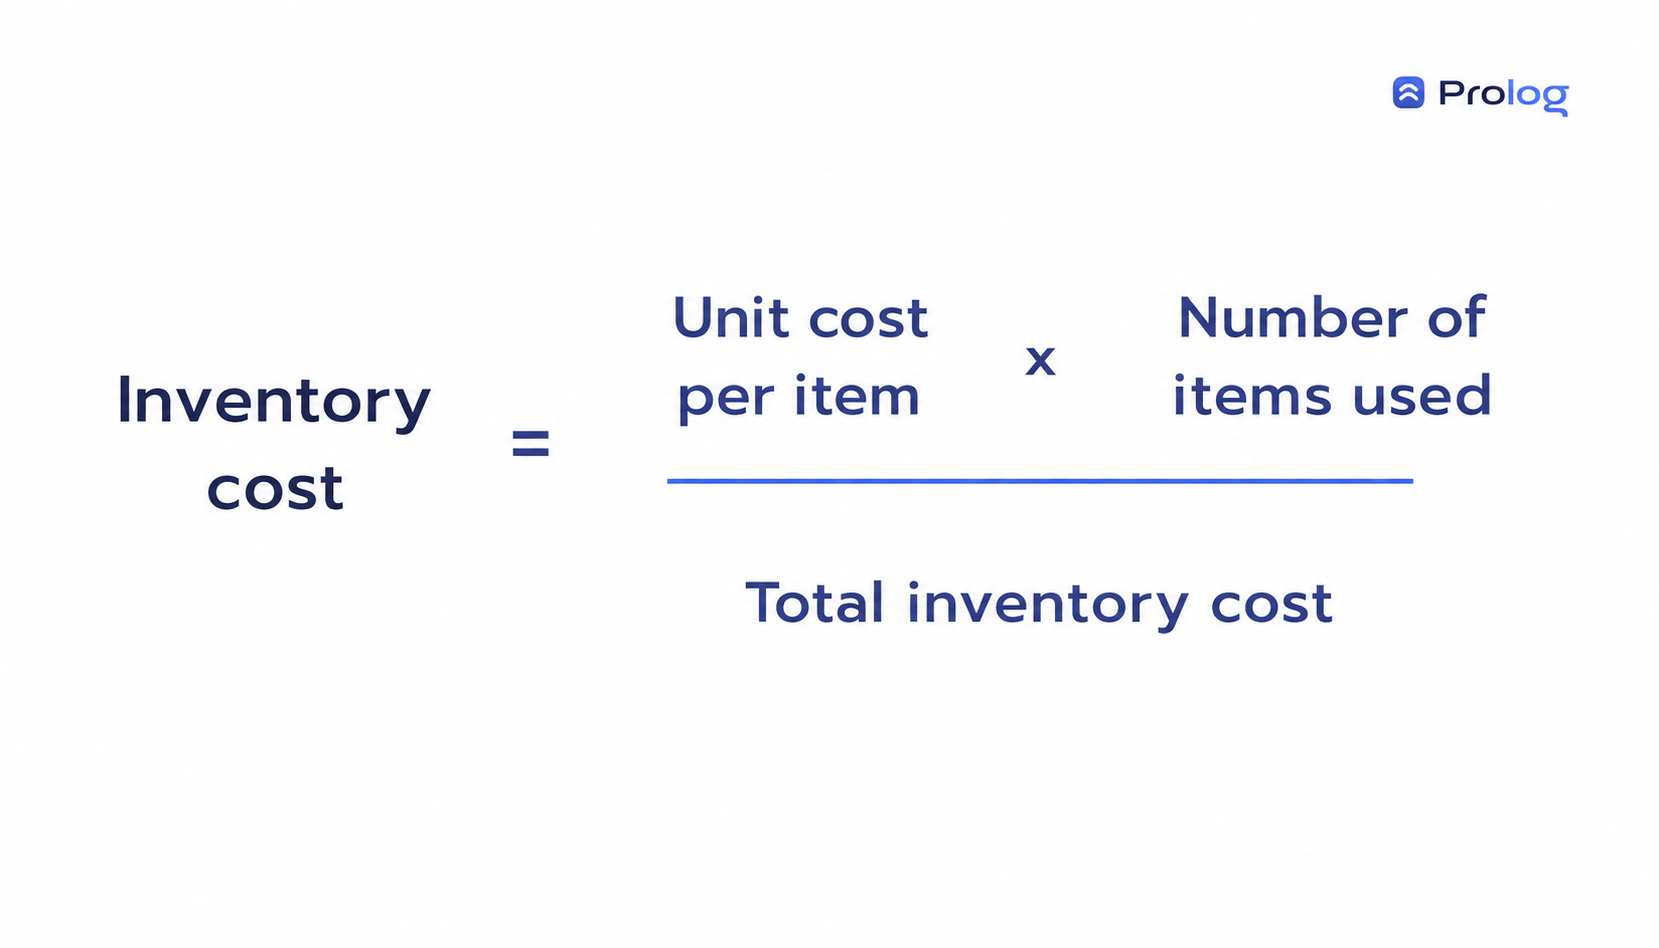
With the percentages calculated, rank the items from highest to lowest value. Then apply the cutoffs defined for each class: the first group on the list goes into curve A, the next into curve B and the last into curve C.
3 – Determine the format for building your ABC curve
There are several alternatives to use as a format: building the curve “by hand”, using pen and paper, applying a digital spreadsheet or implementing a technology system.
Pen and paper
This approach takes more work and can lead to more errors. However, it is a good way to use the ABC curve tactic even when there are no financial resources to adopt a more modern tool that could automate this function.
Spreadsheet
With a spreadsheet, there is still some manual work, but the curve itself can be automated by applying a few formulas when structuring your spreadsheet.
That way, all you need to do is enter the necessary information and keep your tool always up to date so that the curve is as faithful as possible to the reality of your fleet.
System
A technology-based system is an important alternative for fleet management, because it makes access to information easier and reduces the manual work of organizing the items.
In addition, the inventory management system is generally linked to the fleet maintenance system. That way, the use of parts and items for services is linked to the services themselves.
Curious and want to better understand how this type of system works? Request a free system demo with one of Prolog's specialists.
Frequently asked questions
What are the A, B and C curves?
How do you calculate the split between A, B and C?
Why apply the ABC curve in fleet management?
What do I need to record for each item in the inventory count?
Do I need a system to build the ABC curve?
// newsletter
Fleet management content, straight to your inbox
Articles on tires, maintenance and fleet operations. No spam.


