
Prolog software: what the app dashboard shows
 Luiz Felipe 4 min read

The Prolog App dashboard screen brings together information that your transport operation cannot afford to leave scattered.
The main goal is to make the data from the features used by the fleet available quickly and in one place. This way, you find tables and charts with important information to improve management and keep better track of the operational routine.
To better understand what we are talking about and what you really gain from using Prolog, see how the panel organizes this data:
What is the Prolog dashboard like?
A dashboard, by definition, is a control panel. Its function is to show the main information of the tool or platform in question. In Prolog's case, this is tire and vehicle data, collected according to the subscribed solution: Tire Management, Electronic Checklist or both.
Take a look:
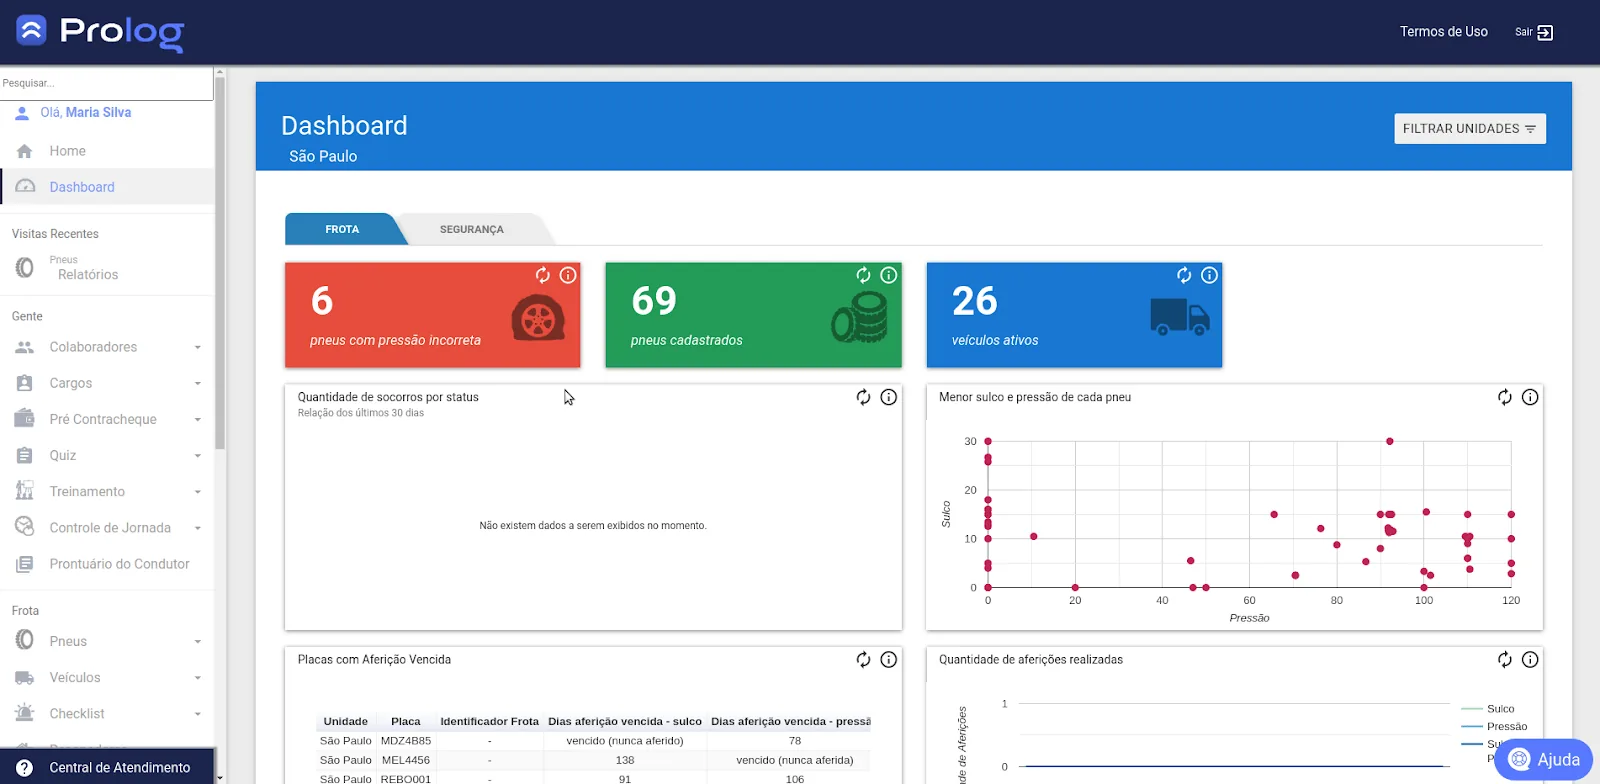
As you can see, the highlighted data shown on the dashboard are:
- Active vehicles [blue]
- Registered tires [green]
- Tires with incorrect pressure [red]
This is a default view, but you can also choose between seeing the ENTIRE fleet and seeing ONLY reported issues that threaten the safety of drivers and vehicles.
Next, you can choose a view by tags, selecting one, two, three or all of them: Roadside Assistance; Tire; Checklist; Vehicle; All.
Then, the dashboard presents charts and tables. Among them is the “number of roadside assistance requests by status” chart for the last 30 days, counted from the opening date. It shows how many “roadside assistance requests” are open, closed or in progress.
You can also see the “lowest tread depth and pressure of each tire” view, which shows the lowest tread depth and pressure values collected at the branch office for each tire.
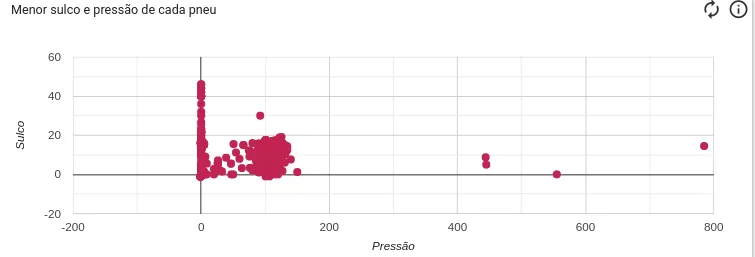
Other chart or table models for viewing information on the Prolog App dashboard are:
- License plates with overdue inspections.
- Number of tire inspections performed.
- Checklists performed / day.
- License plates with the most open W.O. items.
- Checklists performed in less than 1 minute and 30 seconds.
- Blocked license plates.
- Number of tires by status.
- Number of open services by type.
- Inspection summary.
- License plates with tire(s) below the millimeter limit.
- Km driven on tire(s) with issues.
- Average repair time for services.
- Total open W.O. items.
How to make good use of the data in the system?
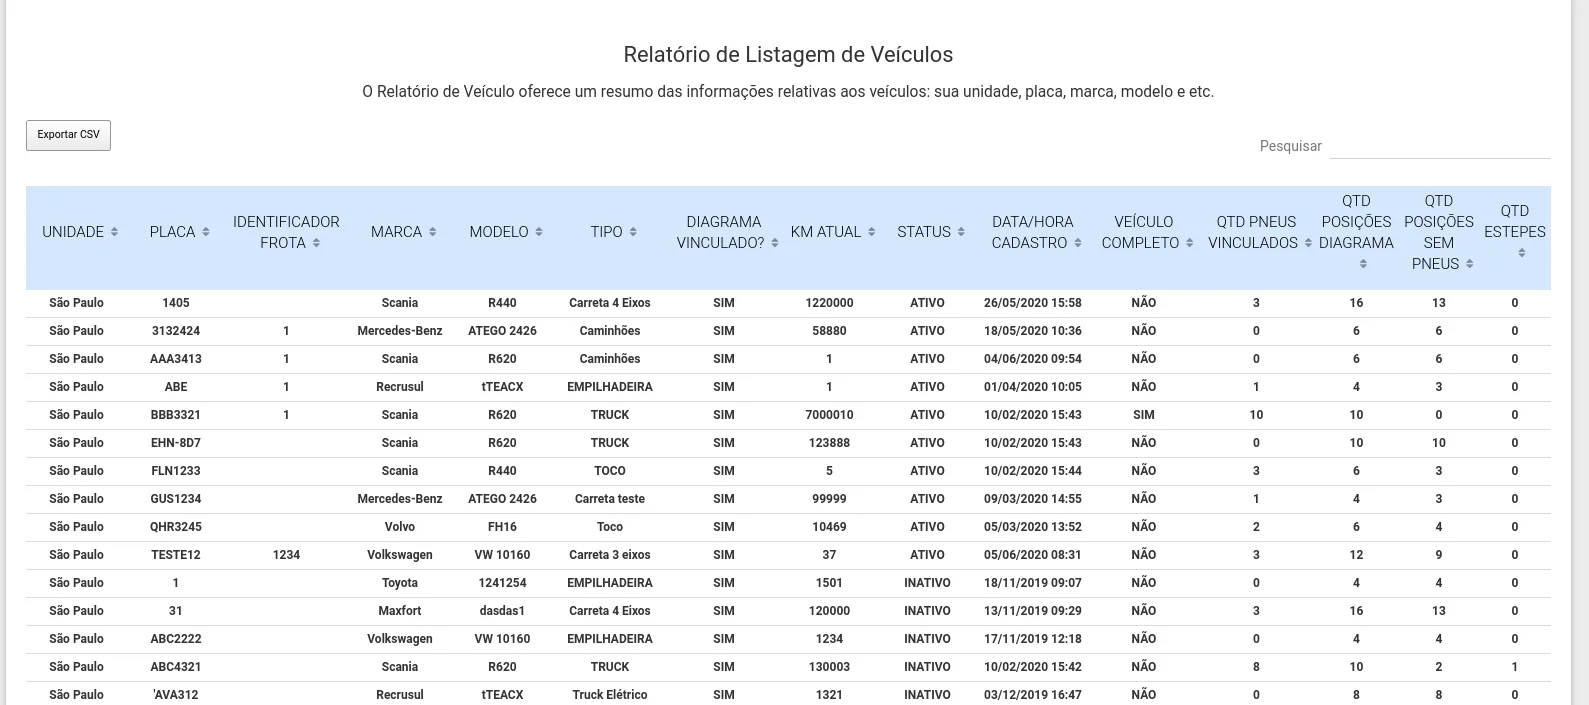
Simply collecting data consistently is already an important step in fleet management. Based on this data, it becomes easier to have a complete view of the operation and make smarter decisions, with the potential to bring better results for the transport company.
Tire pressure data, for example, as shown on the Prolog App dashboard, help identify when it is time to carry out calibration. They even indicate that the trip should not take place before this action is completed.
This is essential to avoid excessive tire wear or irregular wear, since both high and low pressure cause unevenness that damages the tire's structure. This condition can also affect vehicle performance and increase fuel consumption.
So, by correctly performing the fleet's vehicle inspections and tire inspections, the system will have complete and up-to-date information for you to analyze and decide on the next steps.
To make this work even easier, the system automates several reports for you.
In the vehicle checklist area, you can access reports such as the general checklist summary, breakdown of Work Orders, number of NOK (not OK) items, average repair time per item, and so on. You can also use filters by operation, vehicle and/or period.
In the tire area, the reports include open and closed services, replacement forecast, last inspection, tire wear and a general tire summary.
Why use Prolog App?
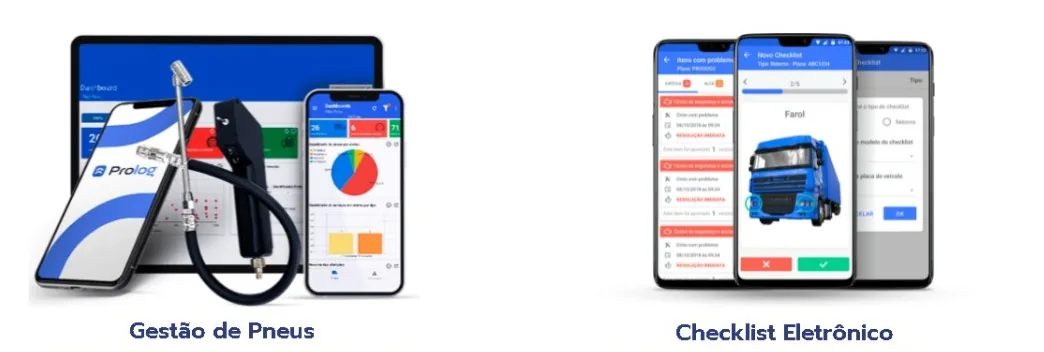
First, because work in the fleet's routine becomes more productive. Also, because more organized management helps pursue cost reductions in the operation.
Second, because your fleet data management becomes more practical and efficient, especially if your control method still depends on spreadsheets.
In addition to collecting data on the fleet's tires, you can share this information with an ERP system or a logistics control tower through the Prolog API.
The system brings together benefits such as standardization of the operation, process automation, productivity of drivers, inspectors and mechanics, easier data integration and support for smarter decisions.
Take the first step to improve your management and book a free demo of Prolog App.
Frequently asked questions
What is the Prolog App dashboard?
Which data are highlighted on the dashboard?
Which charts and tables does the dashboard include?
Where does the data that feeds the panel come from?
Which reports does Prolog App generate?
Can Prolog data be integrated with an ERP?
// newsletter
Fleet management content, straight to your inbox
Articles on tires, maintenance and fleet operations. No spam.


