8 tire management indicators, from CPK to scrapping
 Diego Paludo 4 min read
Performance indicators in tire management are an excellent way to understand whether your actions in this area are having the expected effect.
It is important for any type of management to determine which KPIs to keep track of. After all, they show whether a goal is being achieved and how close or far away you are from it. See the main tire management performance indicators below.
Total fleet maintenance cost
In addition to tire and fleet maintenance costs, you need to include preventive and corrective services on the vehicles' structure.
This is because, if maintenance costs are out of control, tires may be partly responsible. Since they “connect” the vehicle to the ground, every impact they suffer is also transmitted to the vehicle.
For example, low calibration pressure can make the vehicle sway more often. It can also cause more friction in certain parts of its structure, leading to wear and potentially even loose parts.
Among other situations, whenever tires are not in ideal running condition, vehicles receive impacts that increase the fleet's total cost of maintenance.
This indicator can therefore be tracked over time to understand the effect of proper tire management processes.
Keeping track of internal tire pressure
This is one of the tire management performance indicators that helps reveal the causes of and influences on tire wear levels.
The main information it provides is how well a tire maintains the correct tire calibration.
It can also help explain which problems lead to rapid pressure loss, identify when pressure changes occur and whether the responsible driver carried out the inspection and/or calibration as planned in their routine.
Want to see this in your fleet? Talk to a Prolog specialist
Tire tread depth control
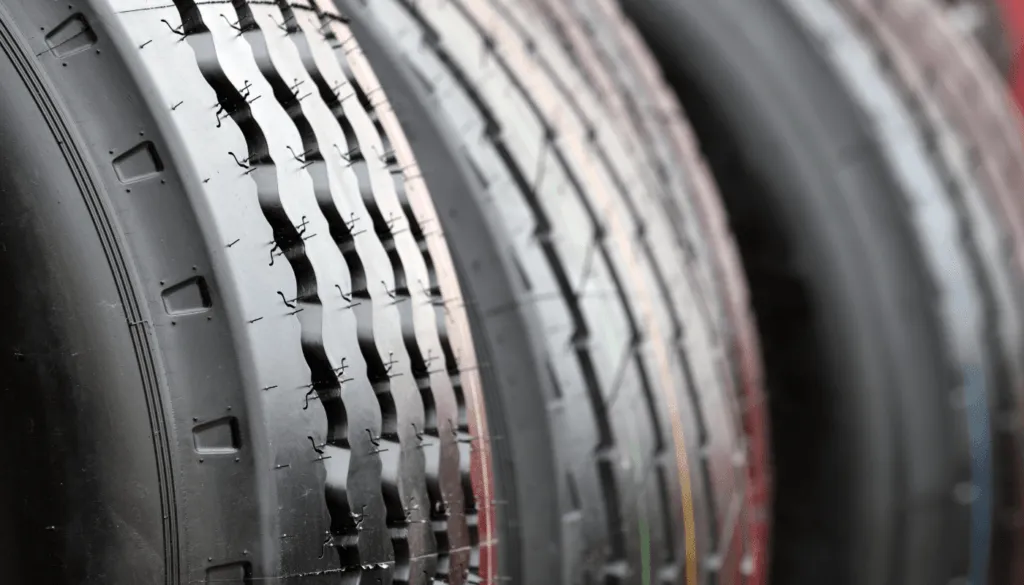
Tire tread depth shows how much the tire wears during its period of use. Typically, this measurement is taken every 30 days, but it can also be taken every two weeks if the vehicle is used more frequently.
As a tire management performance indicator, it provides crucial information for controlling wear levels, as well as understanding the causes of each wear type and which solutions you need to adopt.
Furthermore, keeping track of tread depth helps identify the right time to take a tire out of use. This makes it easier to send it for retreading when it reaches the limit set by the fleet or tire manager.
Number of roadside assistance calls due to tire maintenance
First, a warning: ideally, this number should always be zero.
If many cases of on-route tire maintenance start to occur (flat tires, slipping, aquaplaning), you need to identify how often this happens, which vehicles are involved and who the responsible drivers are.
This gives you a clear picture of who may be driving inappropriately and who is not properly carrying out vehicle and tire inspection and care routines.
You also gain enough information to establish parameters and goals for reducing “roadside assistance” in your transport operations.
Tire scrapping rate
This rate represents the average number of tires scrapped each month in your fleet operations. This happens because of a lack of proper tire care and is simply the premature loss of the tire.
Some causes of this premature asset disposal include bead cracks, belt separation, casing fatigue, cuts and punctures, among others.
By keeping track of this indicator, you can understand issues such as:
- The sizes of the scrapped tires and whether they suited the vehicle model they were installed on;
- Which tire make in the operation has the highest scrapping rate;
- The main reason within your operation that leads to tire scrapping.
Of the tire management performance indicators, this is one that can contribute most to understanding which tires offer the best value for your fleet's needs — together with tire CPK, as we will see next.
Tire cost per kilometer
(video in Portuguese)
Tire CPK is one of the most important tire management performance indicators: it shows the tire's cost for every kilometer traveled, allowing you to compare the different makes and models you use and find which offers the best value for money.
This calculation uses tire purchase prices and maintenance and refurbishment service costs, as well as mileage before and after the services.
Contrary to the common belief that the cheapest tires generate greater fleet savings, the best-value models may not have the lowest purchase price, but they will certainly have the most positive impact on cost reduction.
Training hours
This indicator applies not only to tire management but to all fleet areas.
Employee and driver training hours can directly affect their performance and the activities they carry out each day.
You can look up how many training hours each driver received and use the other performance indicators to understand who delivers the best overall results and how training hours are contributing to them.
Fuel consumption
Fuel consumption can increase if tire care is inadequate, so it is an important indicator to keep track of. It lets you investigate tire-related problems if you notice unusual increases.
The most likely tire problems causing greater fuel consumption are severe tread wear and inflation pressure below the ideal level.
Keeping track of these different tire management performance indicators therefore contributes to your operation in several ways.
To keep track of all the necessary data without losing any information, use our free tire control spreadsheet (in Portuguese).
Frequently asked questions
What is tire CPK and why does it matter?
Is the cheapest tire the most economical for the fleet?
What does the scrapping rate reveal?
How many tire-related roadside assistance calls are acceptable?
How often should tread depth be measured?
Why is fuel consumption part of tire management?
// newsletter
Fleet management content, straight to your inbox
Articles on tires, maintenance and fleet operations. No spam.